- Home
- About CCMH
- Membership
- Measures & Tools
- Data & Publications
- Education & News
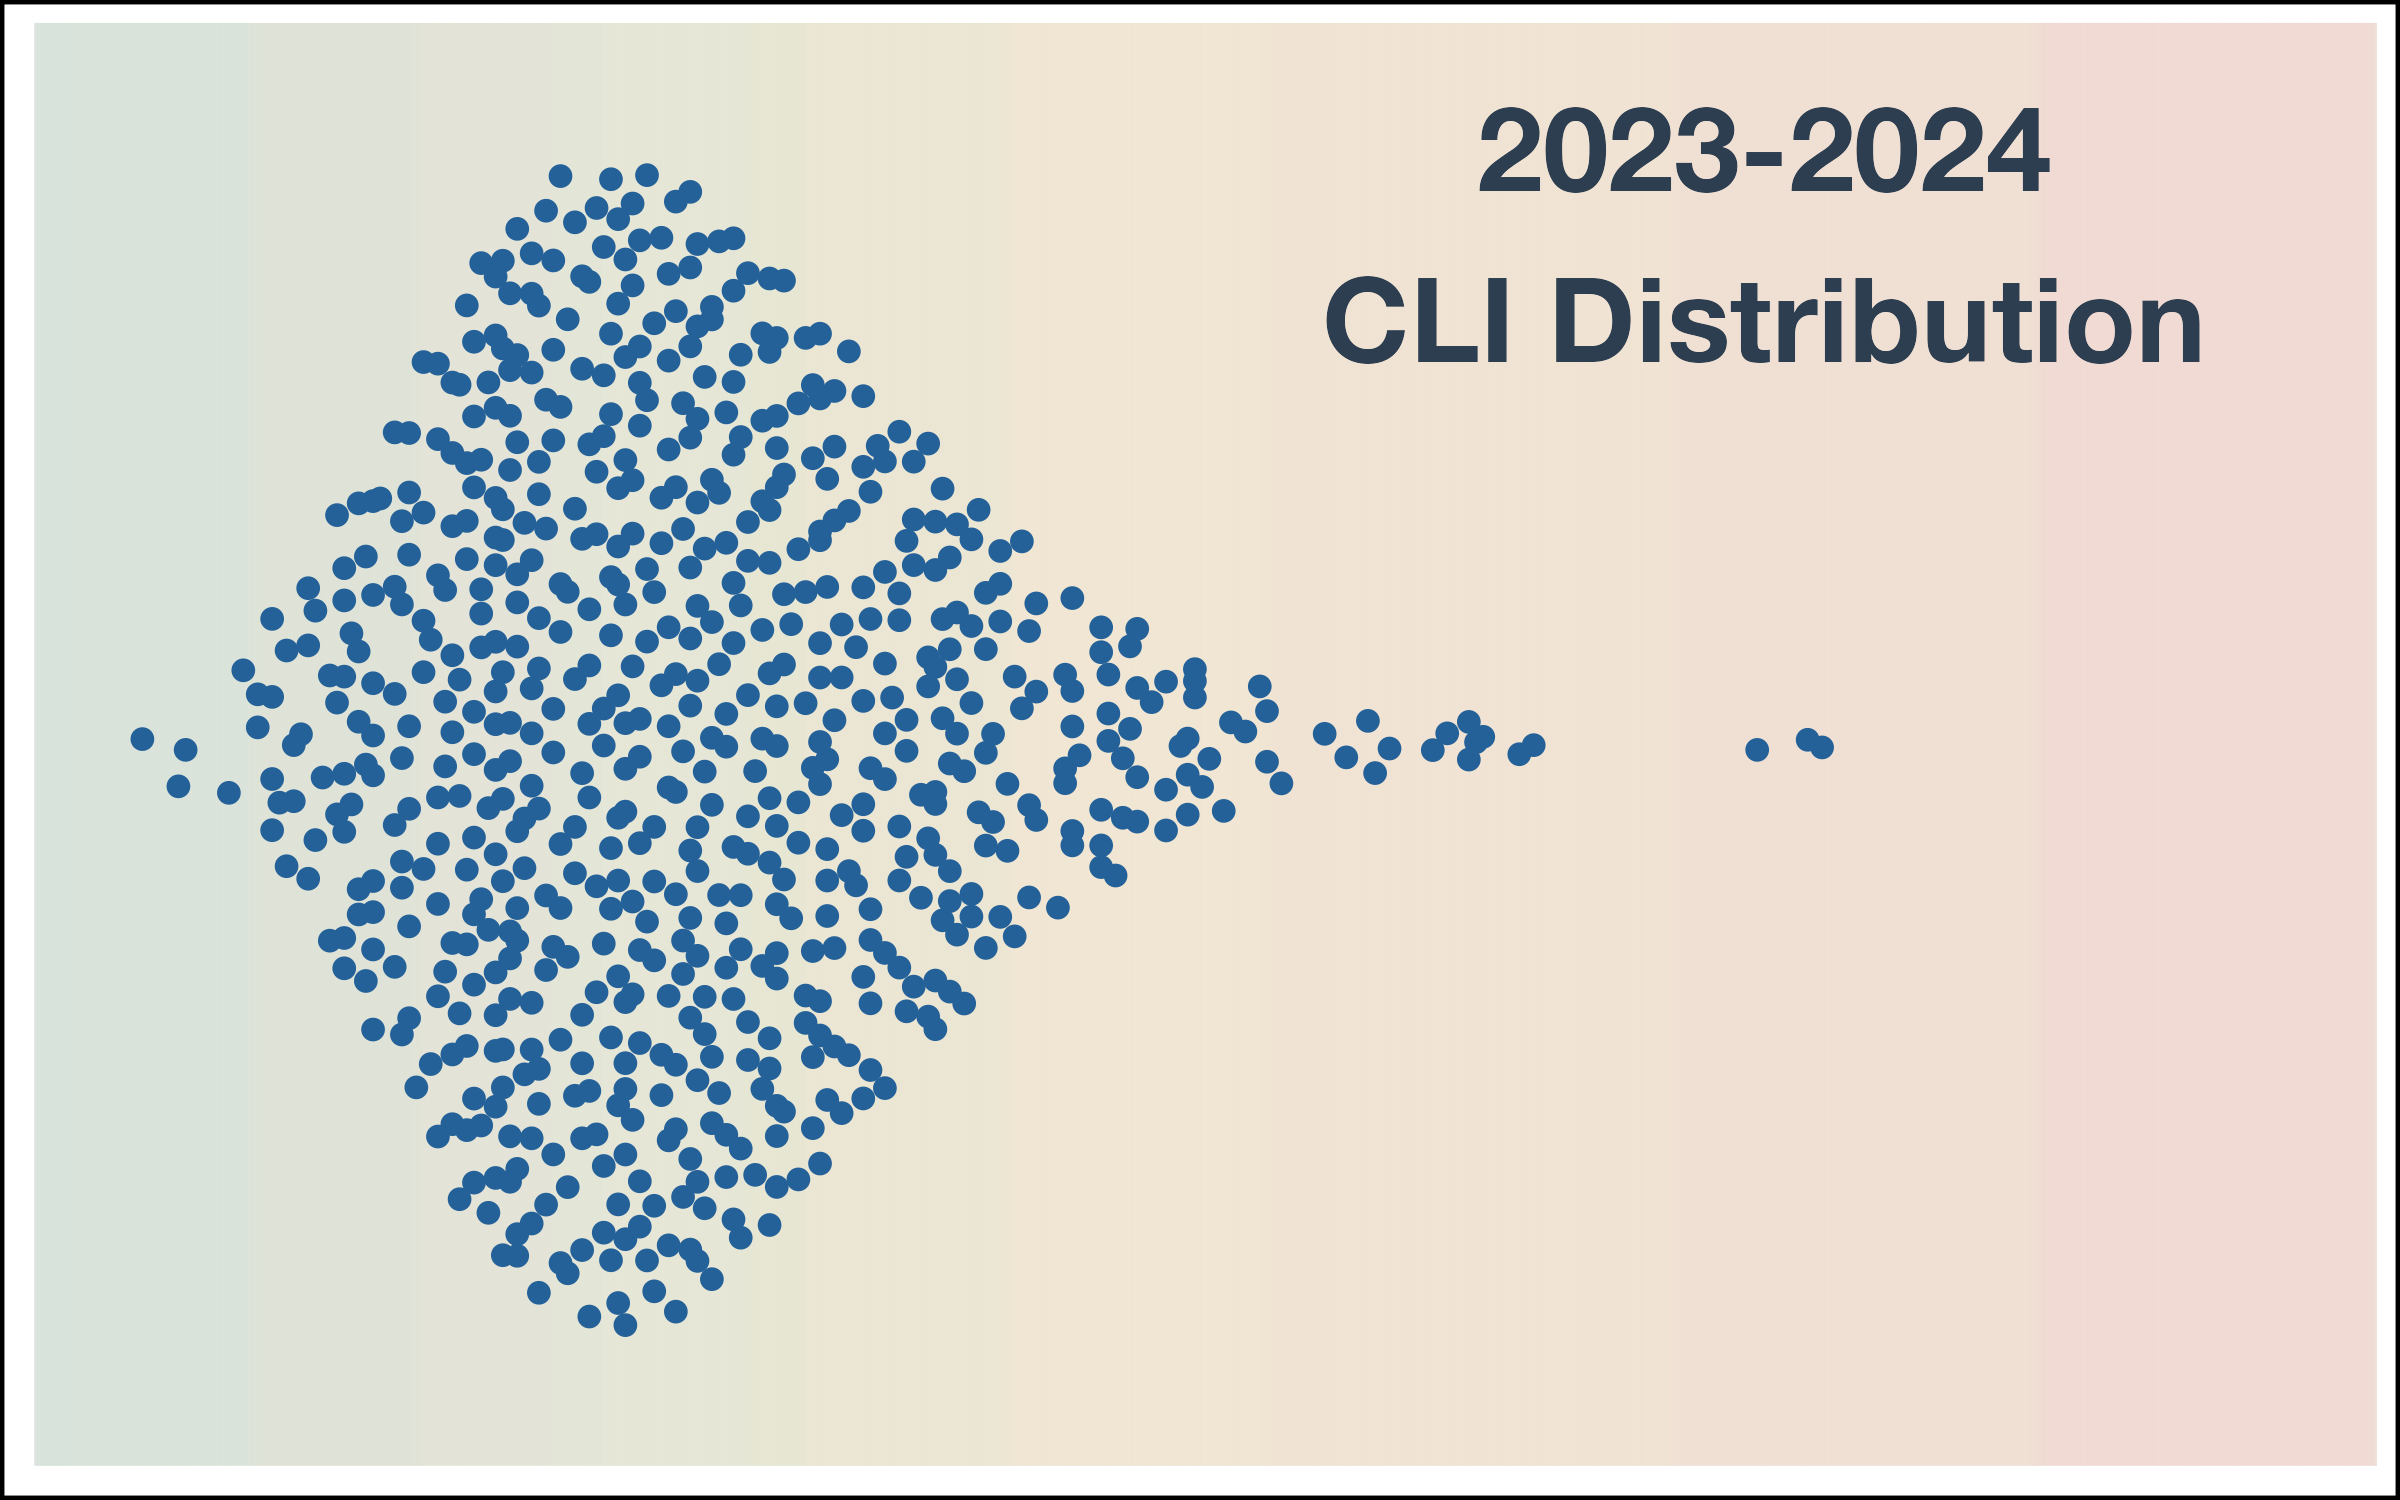
Clinical Load Index (CLI)The Clinical Load Index (CLI) was originally developed in 2017-2018 by the Center for Collegiate Mental Health (CCMH), with support from the Association of University and Counseling Center Directors (AUCCCD) and the International Accreditation of Counseling Services, Inc. (IACS), to inform the complex administrative, funding, and policy decisions related to the resourcing of mental health services in colleges and universities. An individual CLI score can be thought of as “clients per standardized counselor” (per year) or the “standardized caseload” of the counseling center. The CLI is intended to provide a specific, reliable, and comparable distribution of scores that describes the landscape of staffing levels associated with particular clinical outcomes (i.e. treatment dosages and distress change). The CLI is not intended to provide the answer for precisely how to staff a counseling center. Rather, the distribution of CLI scores illustrates the landscape of current staffing levels in order to encourage transparency and clarity about institutional funding and staffing decisions via a reliable and comparable staffing metric. As a result, the CLI helps to shift the question that institutions should be asking from, “How many staff should we have?” to “What services do we want to provide to our students?” or "What experiences do we want students to have when they seek counseling services?” Locke, B. D., Scofield, B. E., Janis, R., & Cummins, A. (2024). Clinical Load Index (CLI): Design, Development, and Review of Research. Journal of College Student Mental Health, 1–23. https://doi.org/10.1080/28367138.2024.2391750 Resources to learn more about the CLI
The Clinical Load Index (CLI): Using the Alignment Model to Guide Counseling Center StaffingWhat Is My Center's CLI?How Does Our CLI Compare to Others?MEMBER BENEFITS: 2024-2025 Distribution
To calculate your CLI, please visit the CLI site. Before using the CLI calculator, all users should understand the following concepts.
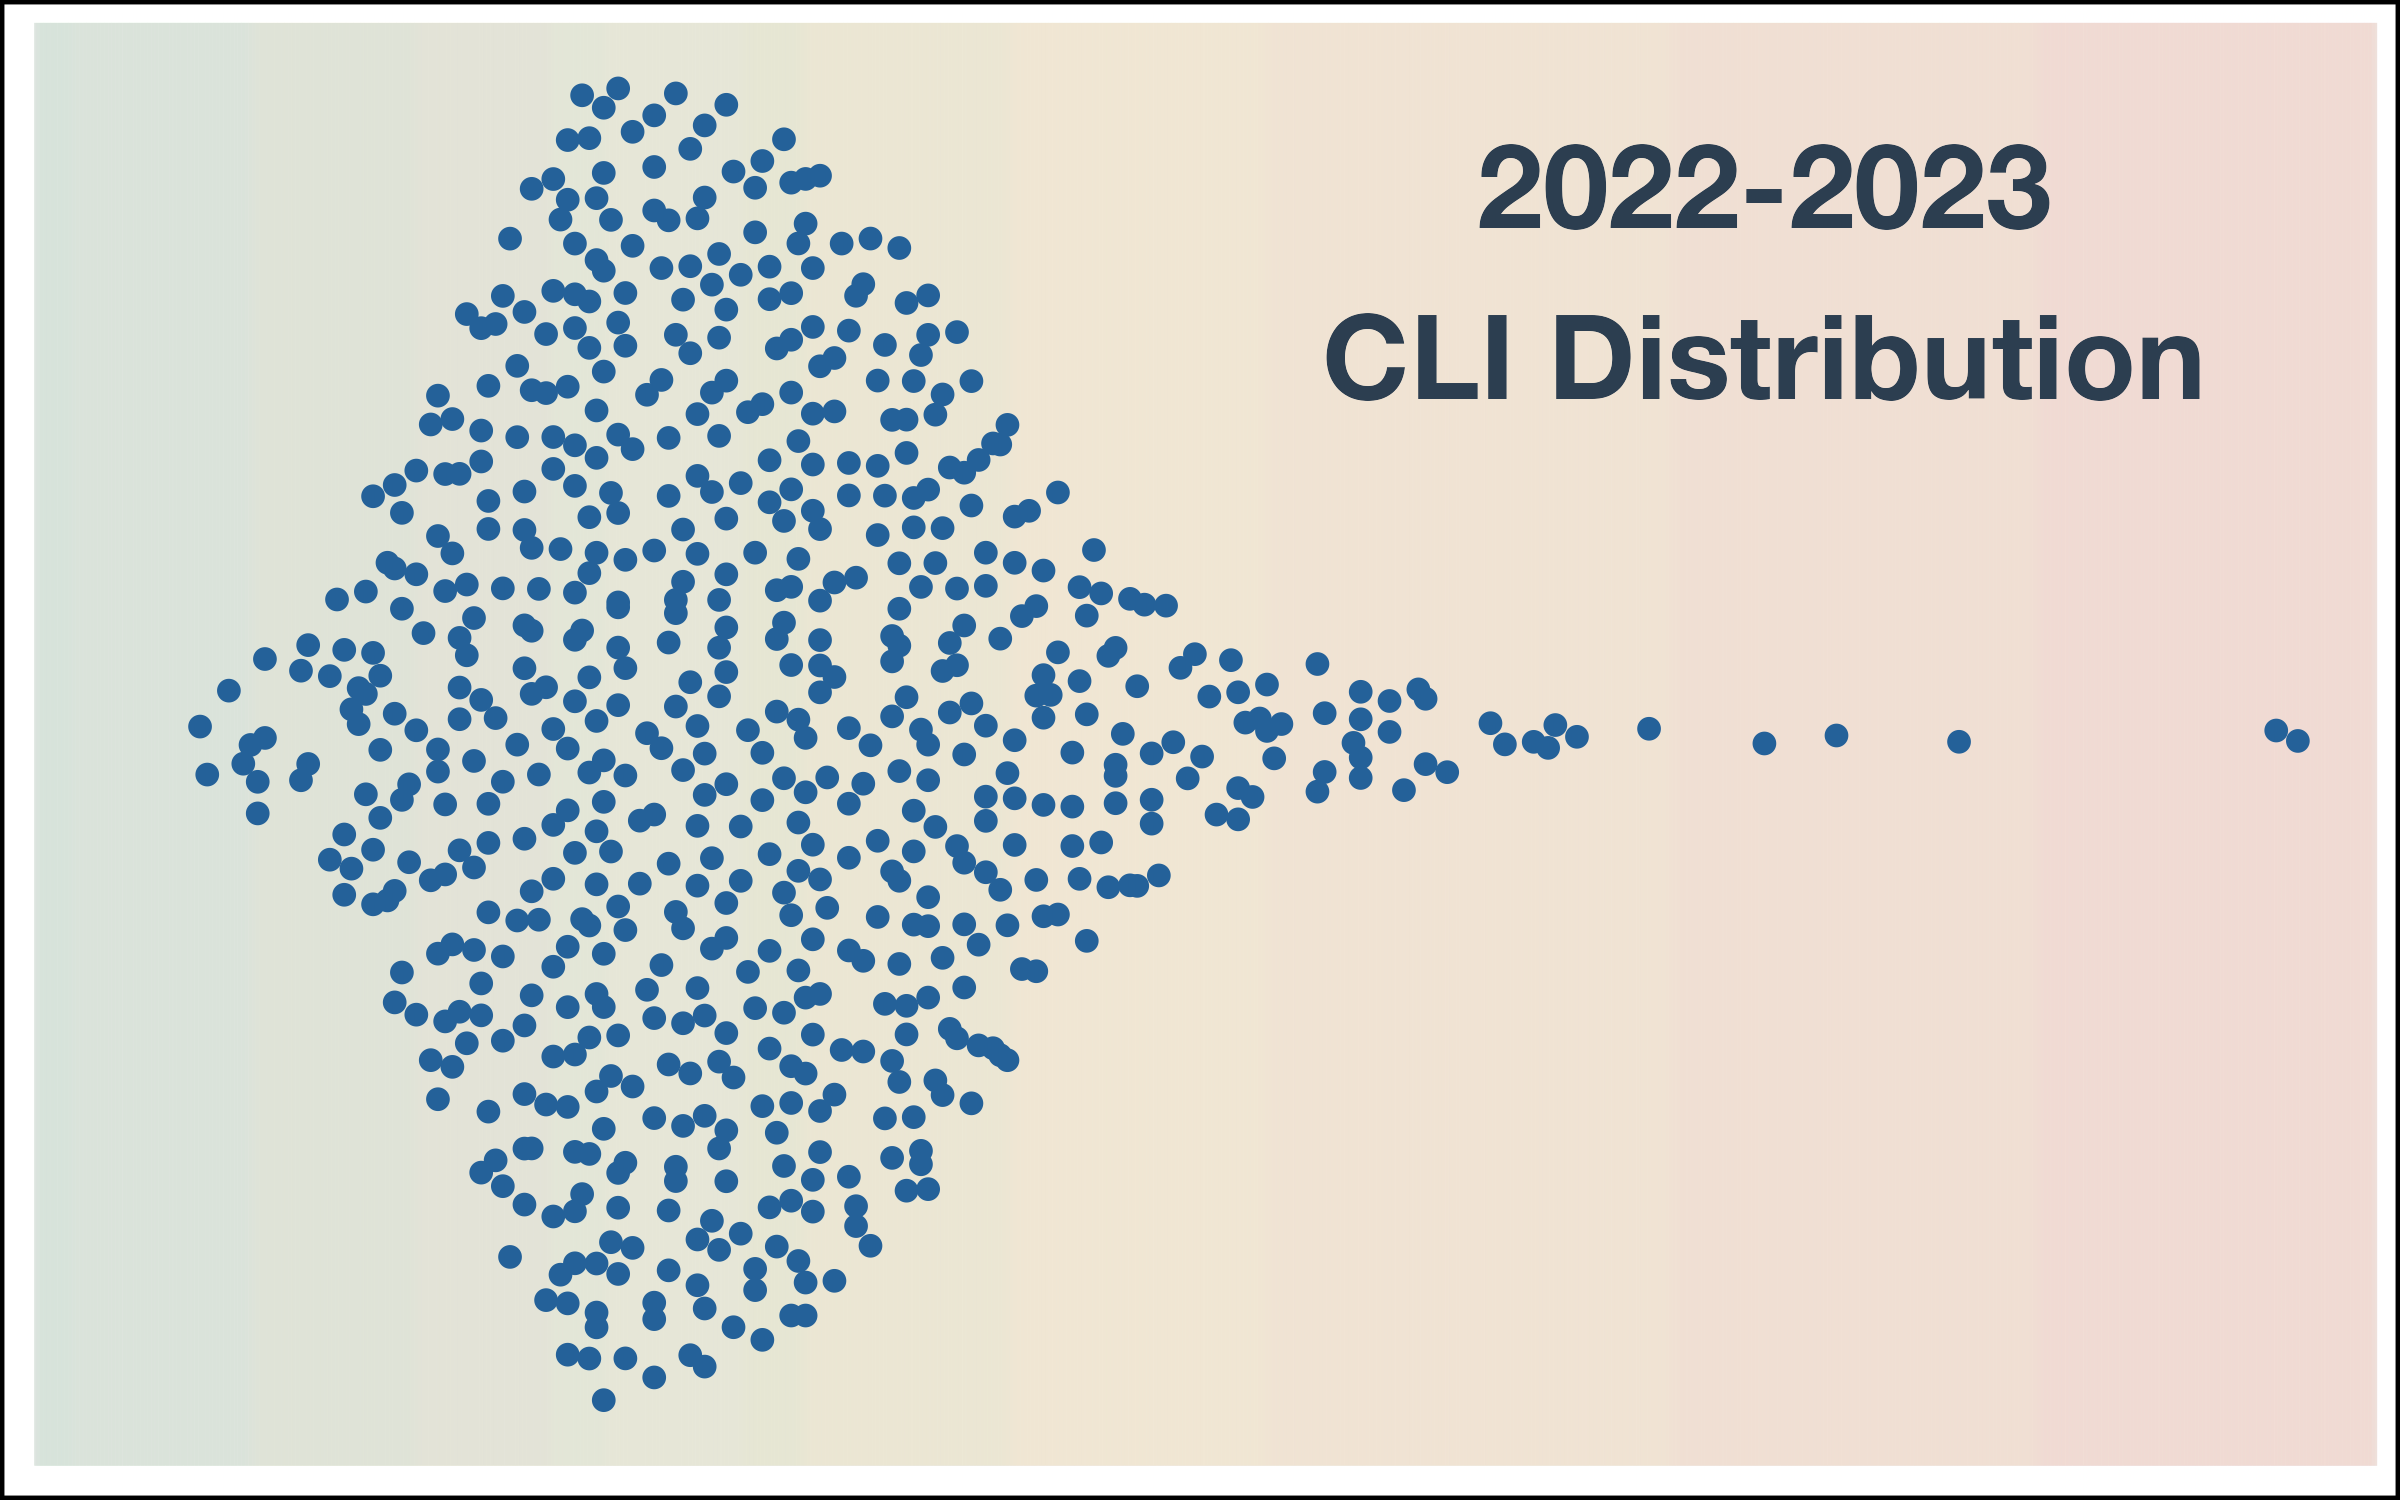
Prior CLI Distributions
2022-2023 Distribution
2021-2022 Distribution
2020-2021 Distribution
2017-2018 Distribution |