College Counseling Centers are Increasingly Treating a Greater Percentage of Students who Represent Diverse Identities: 11-Year Trends
The demography of higher education institutions in the United States has notably changed over the last two decades. For example, the proportion of college students who identify as racially/ethnically diverse has shifted nationally, rising from 45.3% of the general student population in 2010 to 52.1% in 2022 (National Center for Education Statistics, NCES, 2010; 2022). Notably, in the same time period, the percentage of college students who identify as Hispanic/Latino/a/x increased from 11.8% to 18.9%, and the representation of Asian American/Asian students rose from 5.5% to 6.6%. Additionally, there has been movement in the percentage of students from other traditionally marginalized groups, such as the LGBQQ+ (Lesbian, Gay, Bisexual, Queer, Questioning, plus others) and TGNB+ communities (e.g., Transgender, Non-binary, plus others). The proportion of students identifying as TGNB+ in the general student body increased from 1% in 2014 to 4% in 2023 (Healthy Minds Study, HMS, 2014; 2023). Likewise, the American College Health Association (ACHA) noted changes in the proportion of college students who identify as LGBQQ+, rising from 6.6% in 2008 to 19.6% in 2019.
Although the general population within colleges/universities is becoming more diverse, it is unclear if a similar trend is occurring among students treated at university/college counseling centers (UCCs). A better understanding of changes in the demographic makeup of students receiving services at UCCs could highlight both gaps and potential improvements in access to care for various populations, as well as underscore advocacy and service needs for students with diverse identities. As such, the current study explored changes in race/ethnicity, gender identity, and sexual orientation for students receiving services in UCCs over the past 11 years.
The data used for this investigation was gathered from 1,034,528 students who received services from 235 UCCs between the 2012-2013 and 2022-2023 academic years. Data related to race/ethnicity, gender identity, and sexual orientation were taken from CCMH’s Standardized Data Set (SDS) Client Information Form, which is a tool generally completed when students enter treatment at UCCs nationally. See Table 1 in the Appendix for details on sample size across years for race/ethnicity, gender identity, and sexual orientation.
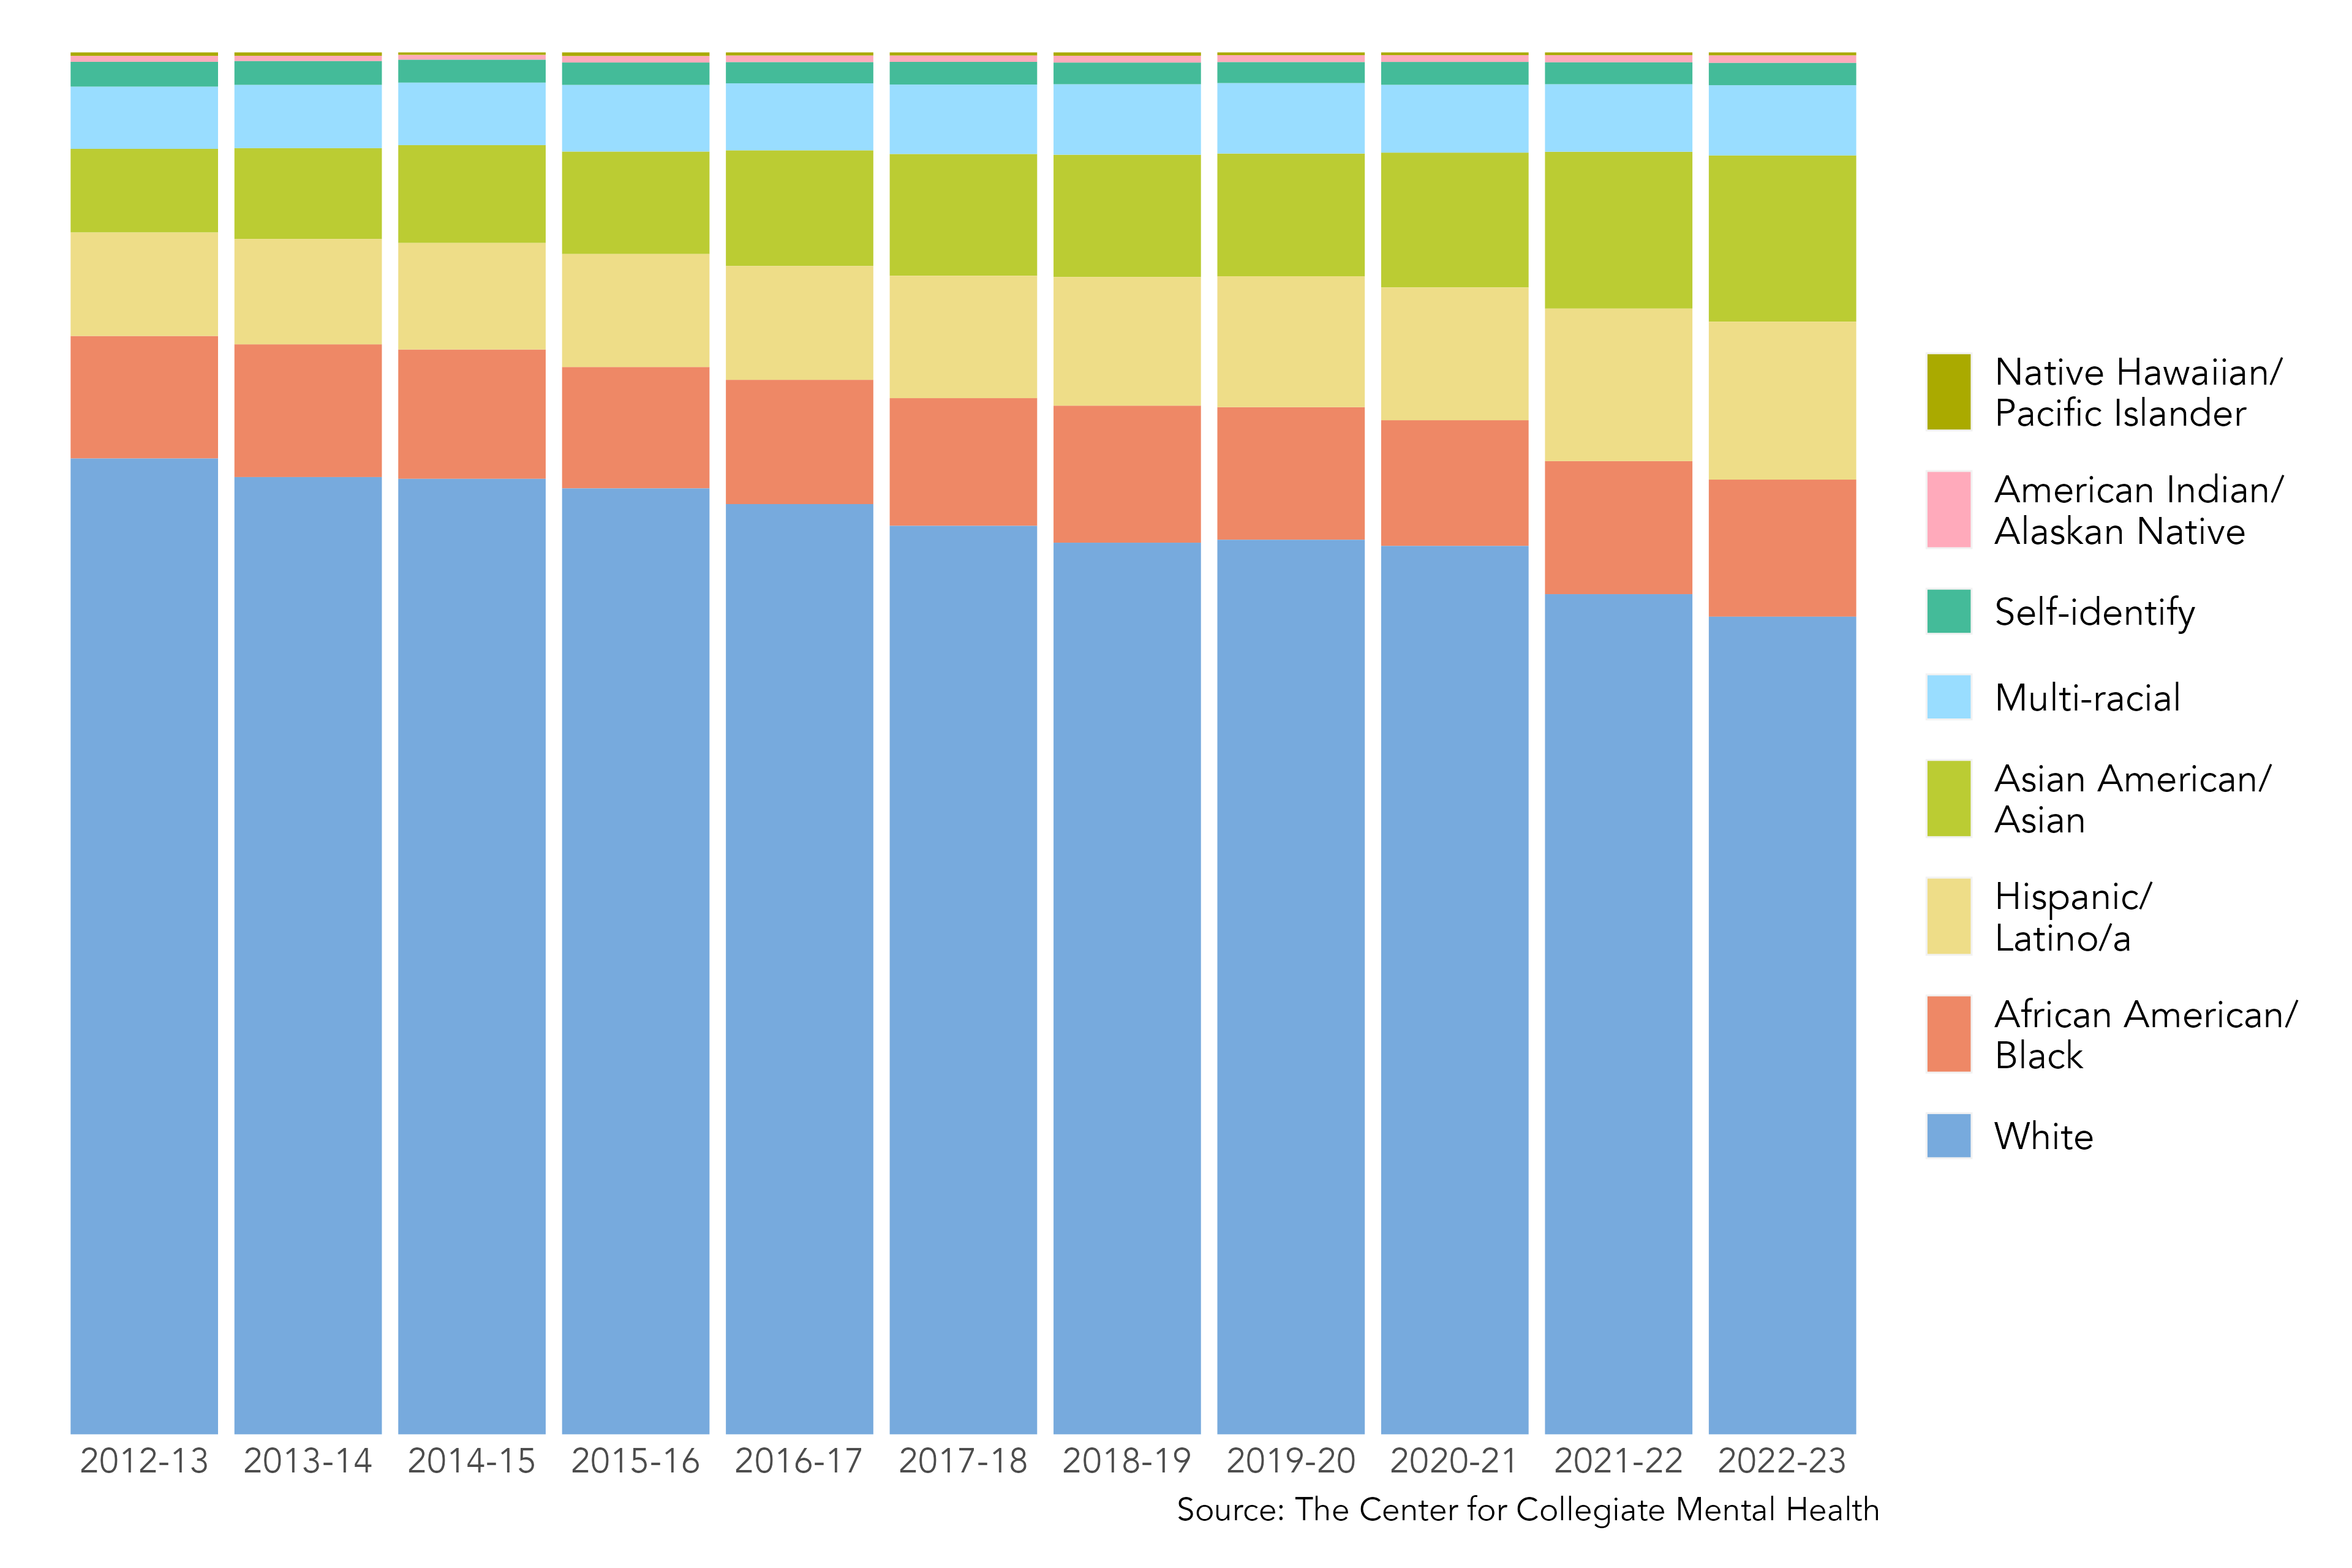
Racial/Ethnic Trends of UCCs
Between 2012 and 2023, the proportion of students who identified as racially diverse increased from 29% to 40%. Specifically, students who identified as Asian American/Asian demonstrated the largest increase in representation at UCCs, rising from 6.1% to 12.0%, while the prevalence of Hispanic/Latino/a students also rose considerably from 7.5% to 11.4%. The percentage of students who identified as African American/Black, American Indian or Alaskan Native, Native Hawaiian or Pacific Islander, multi-racial, and Self-Identity remained relatively stable at UCCs over the 11 year-period. See Table 2 in the Appendix for specific details on the racial/ethnic student changes in students treated at UCCs during the past 11 years.

Gender Identity Trends of UCCs
The prevalence of students who identify as TGNB+ (i.e., transgender man/woman, non-binary, self-identified) increased from 0.7% to 5.7% between 2012 and 2023, while the percentages of cisgender men and women slightly declined during the same time period. Specifically, the proportion of cisgender men at UCC reduced from 36.0% to 32.5%, while cisgender women shrunk from 63.3% to 61.8%. See Table 3 in the Appendix for more details on the shifts in gender identity for students seen at UCCs during the past 11 years.
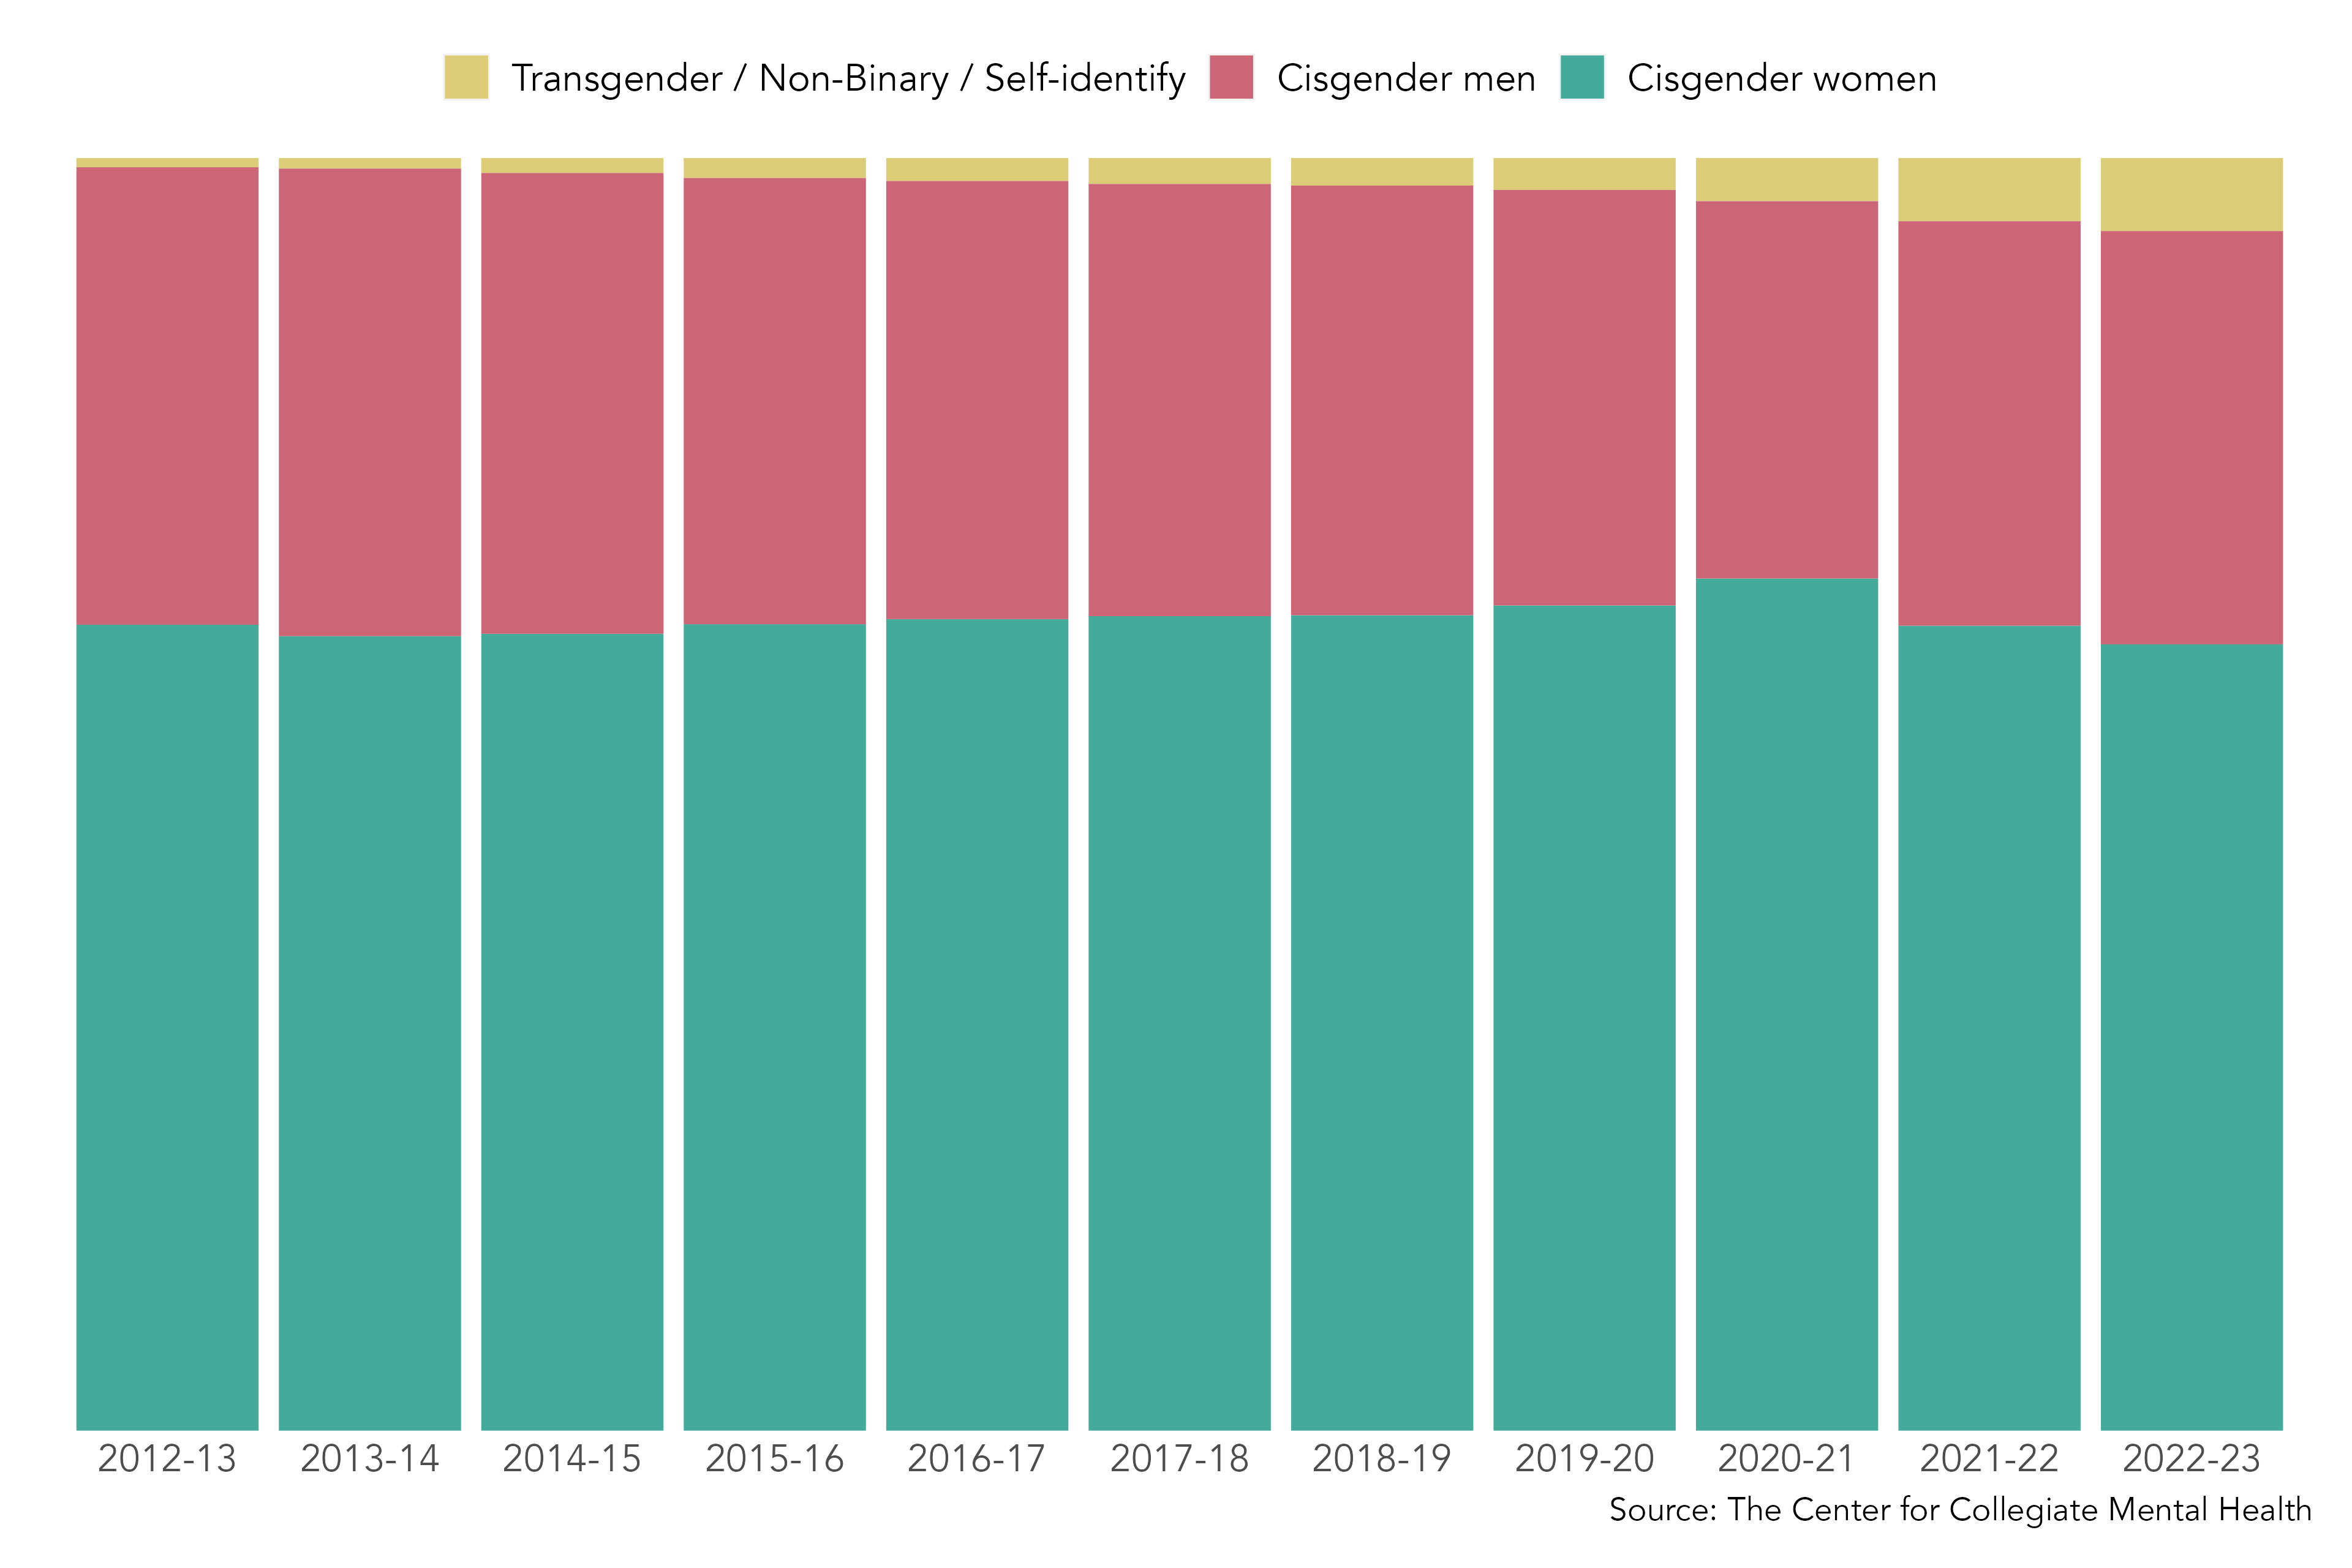

Note. TGNB+ (Transgender, Non-Binary, Self-identity) identities were collapsed due to changes in measurement of these identities in CCMH data collection instruments in 2020.
Sexual Orientation Trends of UCCs
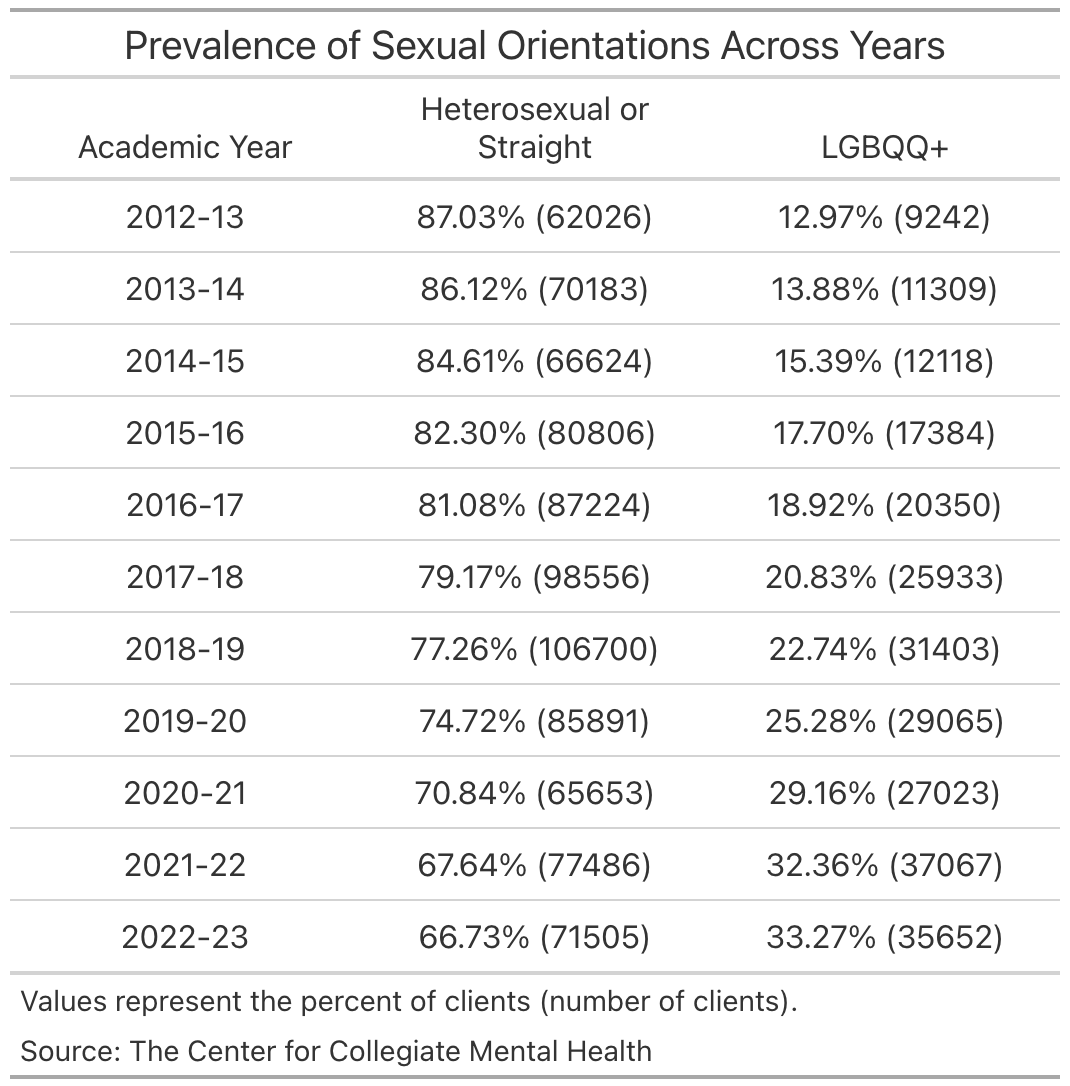
The proportion of individuals receiving services at UCCs who identify as LGBQQ+ increased substantially from 2012 to 2023. LGBQQ+ encompassed individuals who identify as lesbian, gay, bisexual, queer, questioning, asexual, pansexual, or self-identified. During the 2012-2013 academic year, 13.0% of clients identified as LGBQQ+, which increased to 33.3% in 2022-2023. See Table 4 for more detailed information on sexual orientation identity changes across the 11 years.
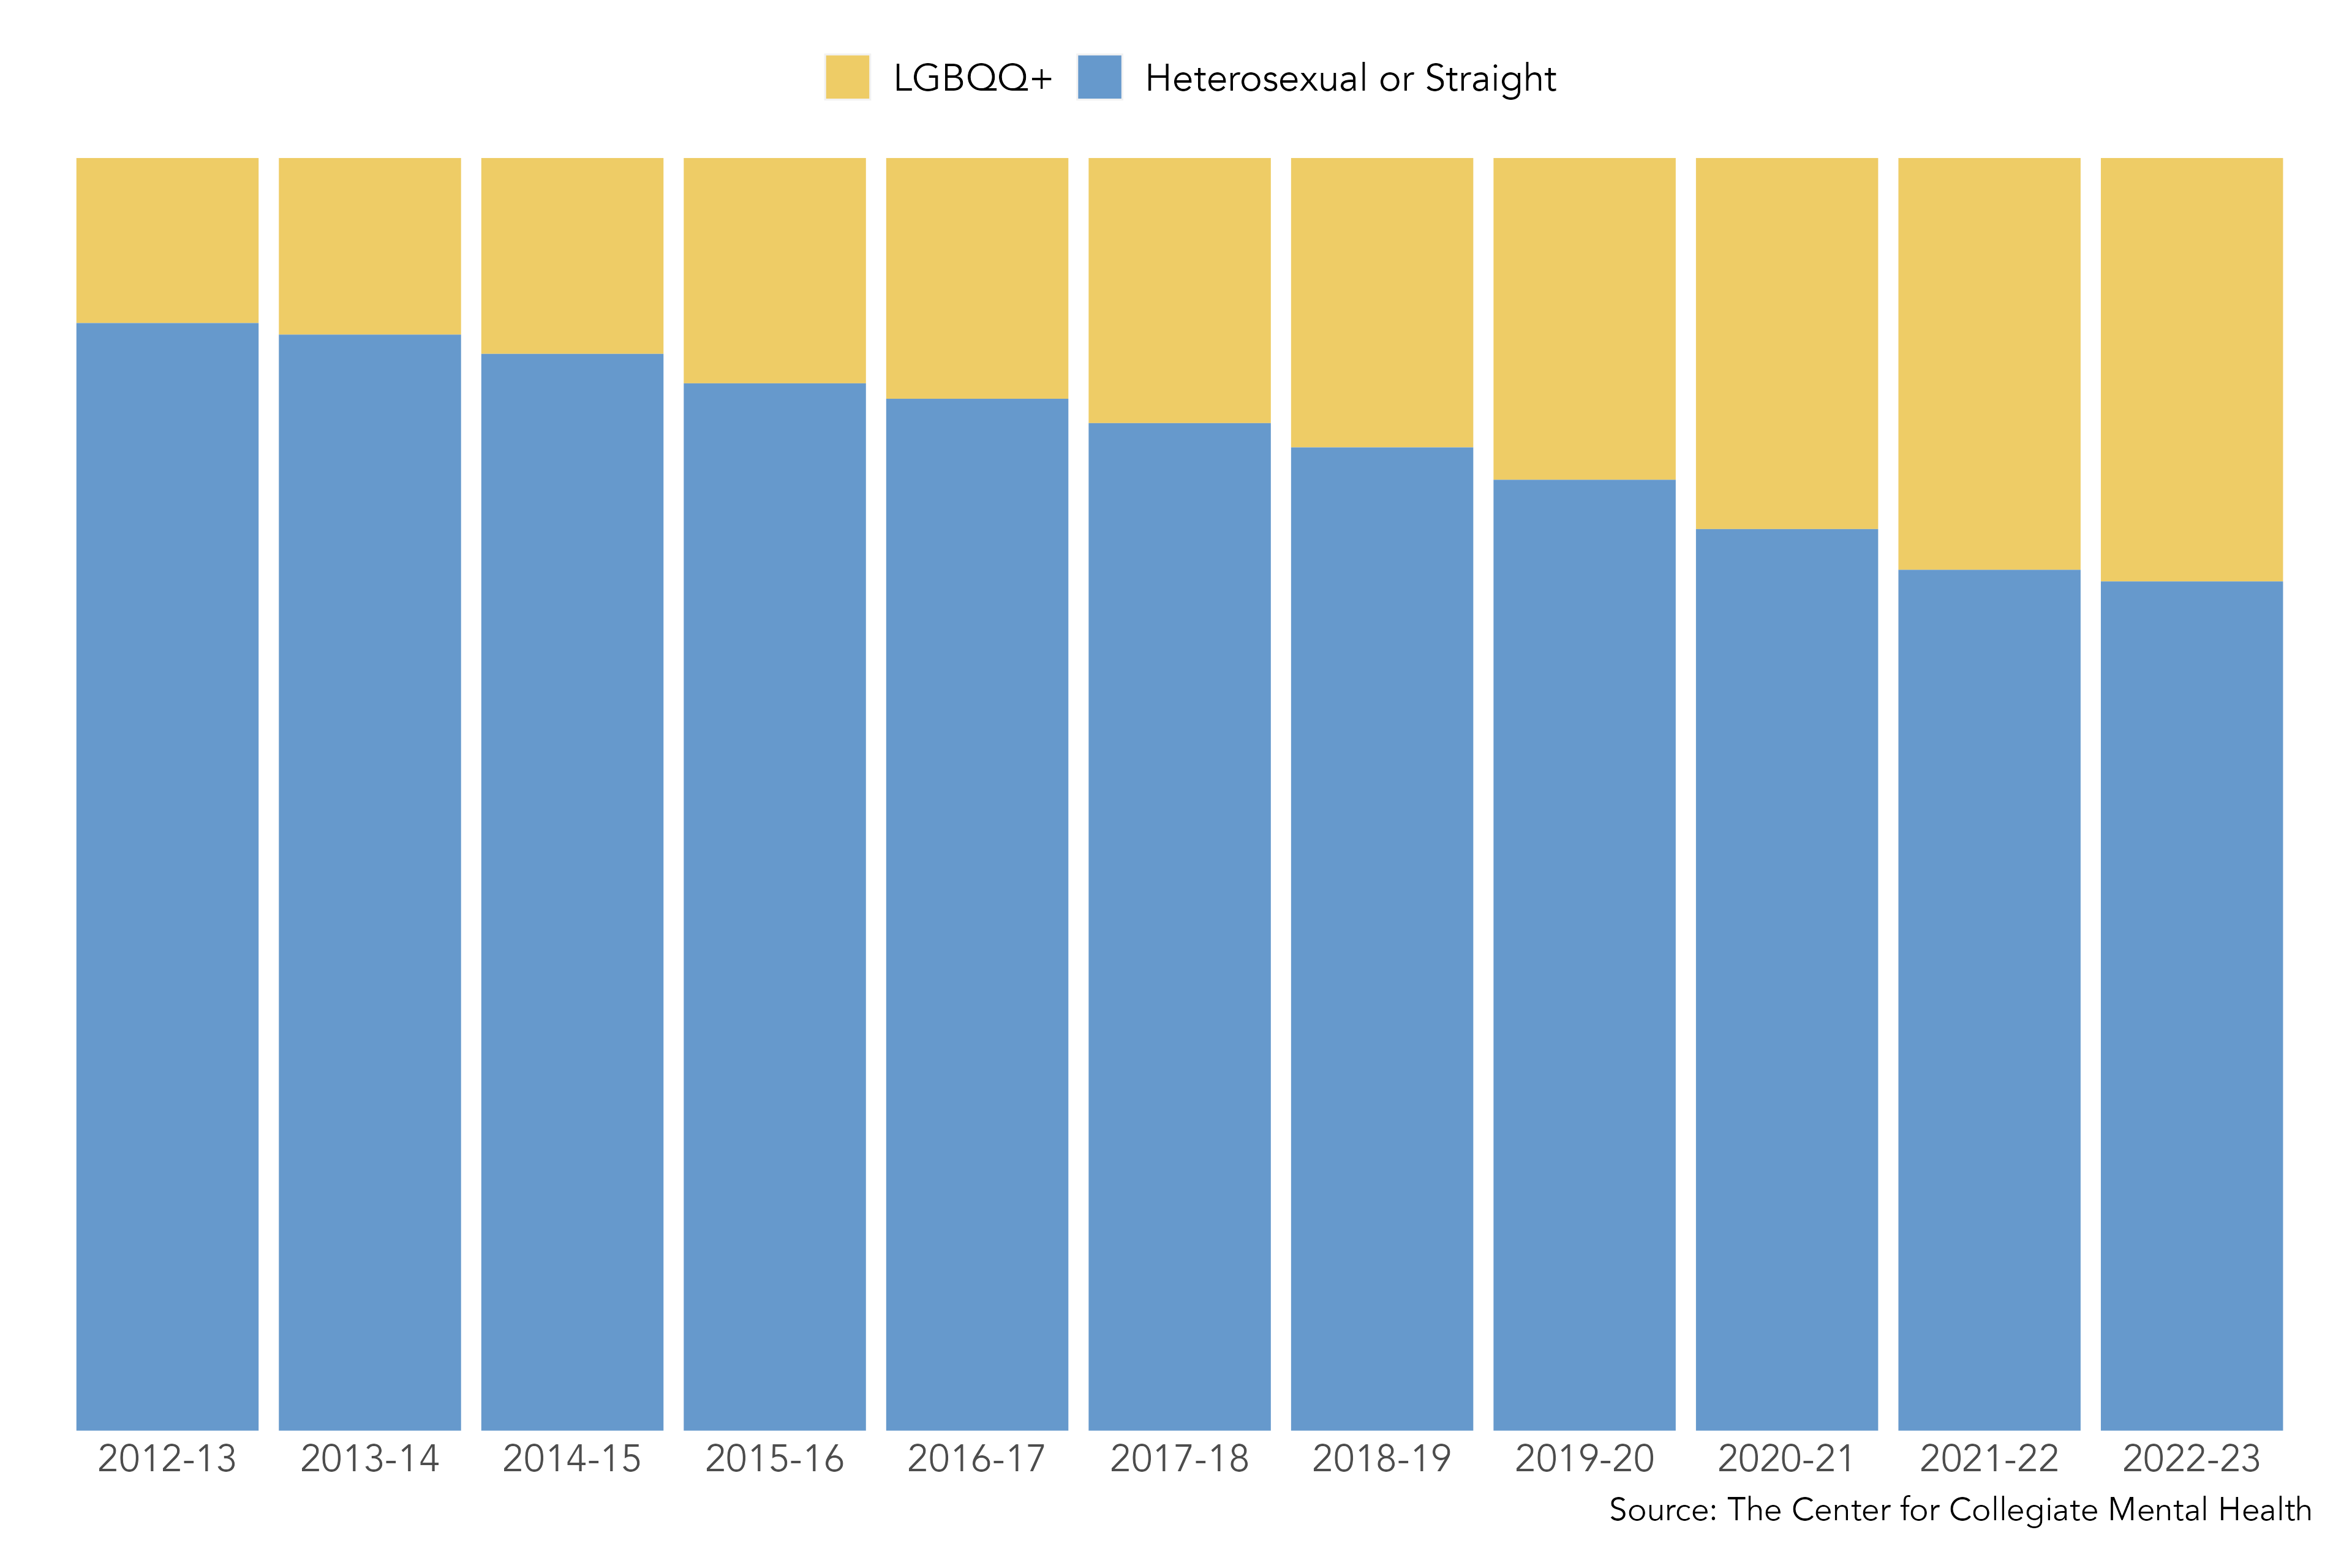

Note. LGBQQ+ identities (Lesbian, Gay, Bisexual, Queer, Questioning, Asexual, Pansexual, Self-identify) were collapsed due to changes in measurement of these identities in CCMH data collection instruments in 2020.
Summary and Implications
- Compared to 11 years ago, UCCs are serving a significantly higher percentage of students who identify as Asian American/Asian, Hispanic/Latino/a/x, TGNB+, or LGBQQ+.
- The reasons why demography of UCC clients has become more diverse are likely multifaceted. For example, some of the changes in representation of demographic groups could partially be attributed to the increase in enrollment of students with those identities in the general student population. In fact, changes in some of the identities of UCC clients treated at UCCs over the past 11 years seem to somewhat parallel the changes in the general student body reported by NCES, HMS, and ACHA during a similar time period. However, many of the shifts in identities represented exceeded the increases reported within the general population, particularly for students who identify as Asian American/Asian, TGNB+ and LGBQQ+. This may indicate that the utilization increases over time could also be ascribed to UCCs being perceived as more accessible and welcoming for students with Asian American/Asian, TGNB+, and LGBQQ+ identities. Future research is needed to further understand the potential reasons for the demography changes in the population of students utilizing UCCs.
- Given that students with diverse identities represent a substantially larger proportion of students treated at UCCs nationally compared to 11 years ago, it is critical that professional development and service offerings are appropriately aligned with these demographic shifts to ensure that clinicians, counseling centers, and the larger higher education community can respond to student needs with greater awareness, preparation, skills, and equity.
References
- American College Health Association. (2009). National College Health Assessment II: Reference Group Data Report Fall 2008.
- American College Health Association. (2019). National College Health Assessment II: Reference Group Data Report Spring 2019.
- Healthy Minds Network. (2014). The Healthy Minds Study: 2014 Data Report.
- Healthy Minds Network. (2023). The Healthy Minds Study: 2022-2023 Data Report.
- National Center for Education Statistics. (2010). IPEDS: Integrated Postsecondary Education Data System: Fall 2010 12-Month Enrollment component.
- National Center for Education Statistics. (2022). IPEDS: Integrated Postsecondary Education Data System: Fall 2022 12-Month Enrollment component (provisional data).
Appendix
Table 1
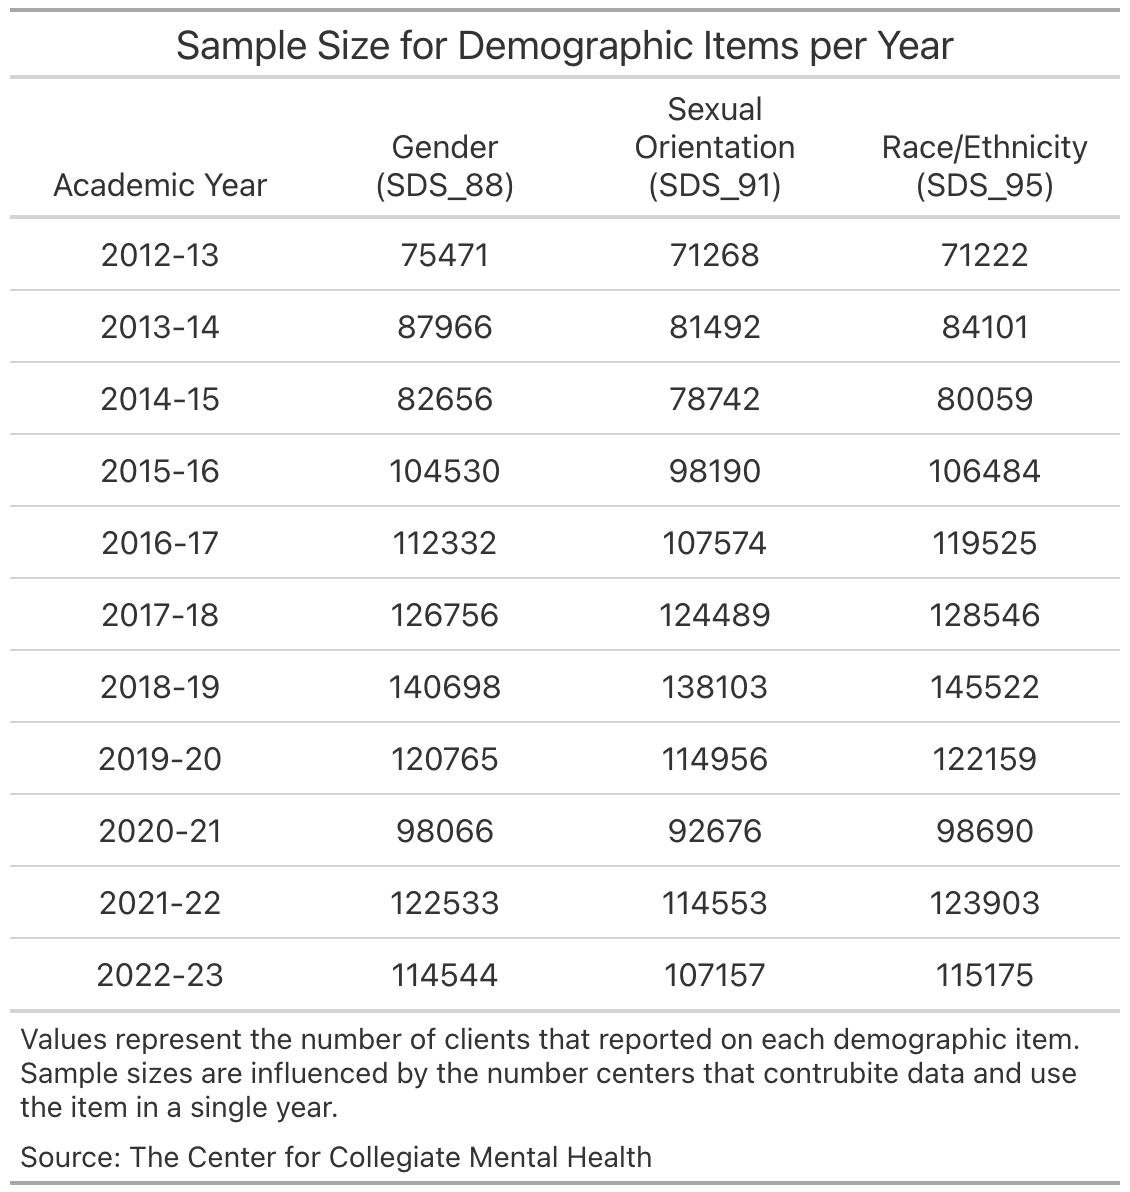
Table 2
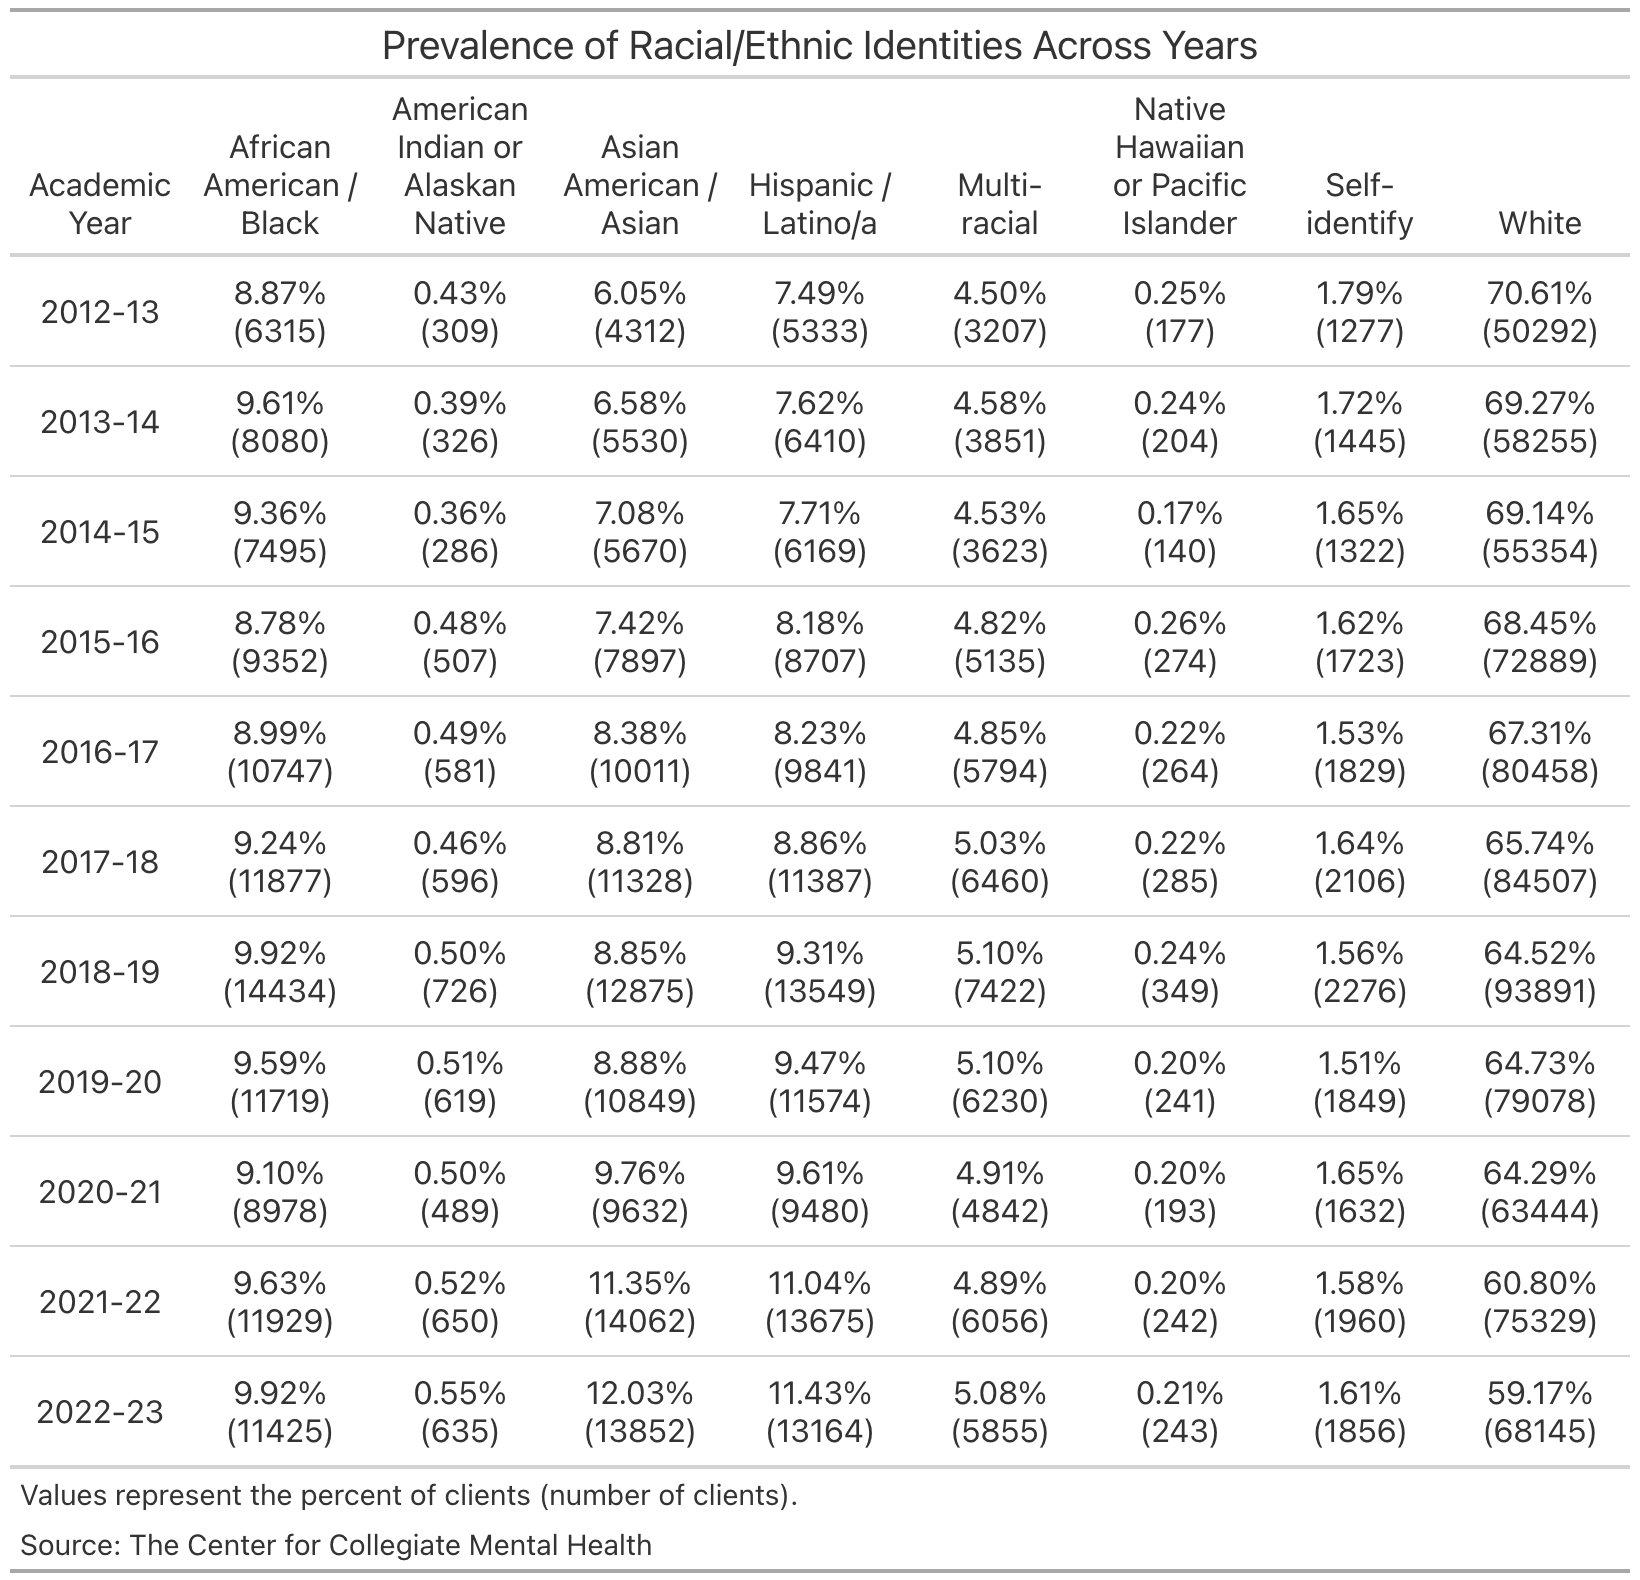
Table 3
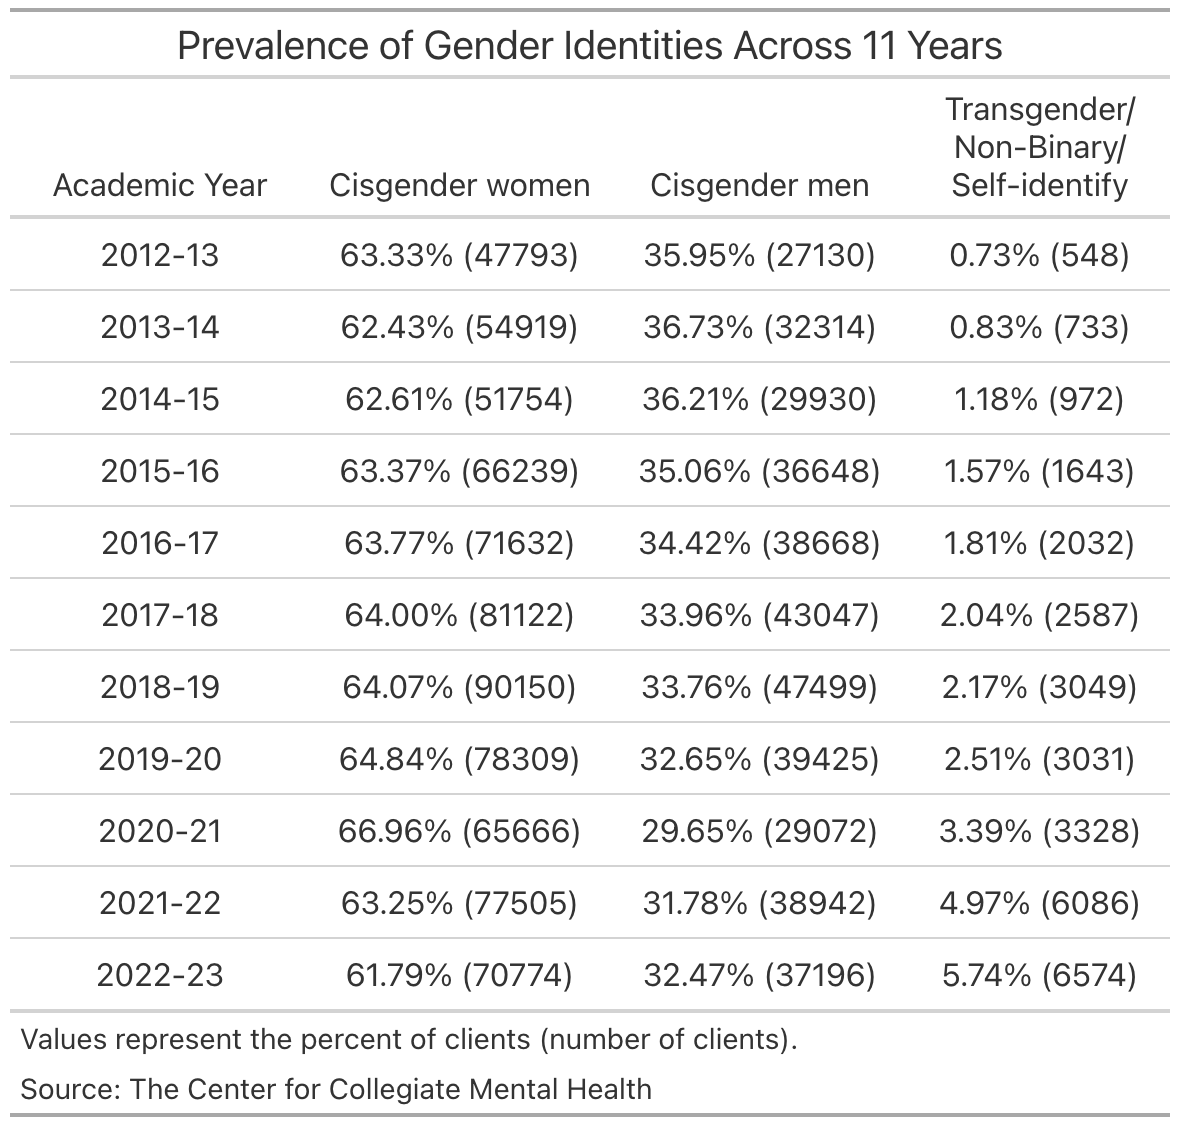
Table 4
This blog post was written by CCMH Data Analyst, Tyler White, M.A.