A Comparison of Telehealth and In-Person Therapy at College Counseling Centers
The COVID-19 pandemic had a substantial long-term impact on how mental health services were delivered across the country. College counseling centers, similar to most other mental health facilities, were forced to abruptly transition to remote services in March of 2020. To better understand this unprecedented systemic migration to remote care, CCMH began collecting data on the service modalities (in-person, video, audio, and text) offered at centers during the early phases of the pandemic. At the time, there were ongoing questions regarding the staying power of telehealth services once students resumed a more typical academic instruction environment, which eventually occurred in 2021-2022. Now, approximately four years after the onset of the COVID-19 pandemic, CCMH completed an initial investigation evaluating in-person, video, and hybrid (combined) services, answering the following questions:
- Has the frequency in mode of individual counseling services shifted since the onset of COVID-19?
- Do attendance rates differ between the modes of service?
- Does presenting symptom severity vary by mode of service?
- Are there differences in how clients improve in treatment between the modes of service?
To answer these questions, information related to mode of service was collected from 205,422 students receiving individual therapy from 171 counseling centers between the 2020-2021 and 2022-2023 academic years. Self-reported initial distress and changes in distress during therapy were assessed using the Counseling Center Assessment of Psychological Symptoms-34 (CCAPS).
Has the frequency in mode of individual counseling services shifted since the onset of COVID-19?
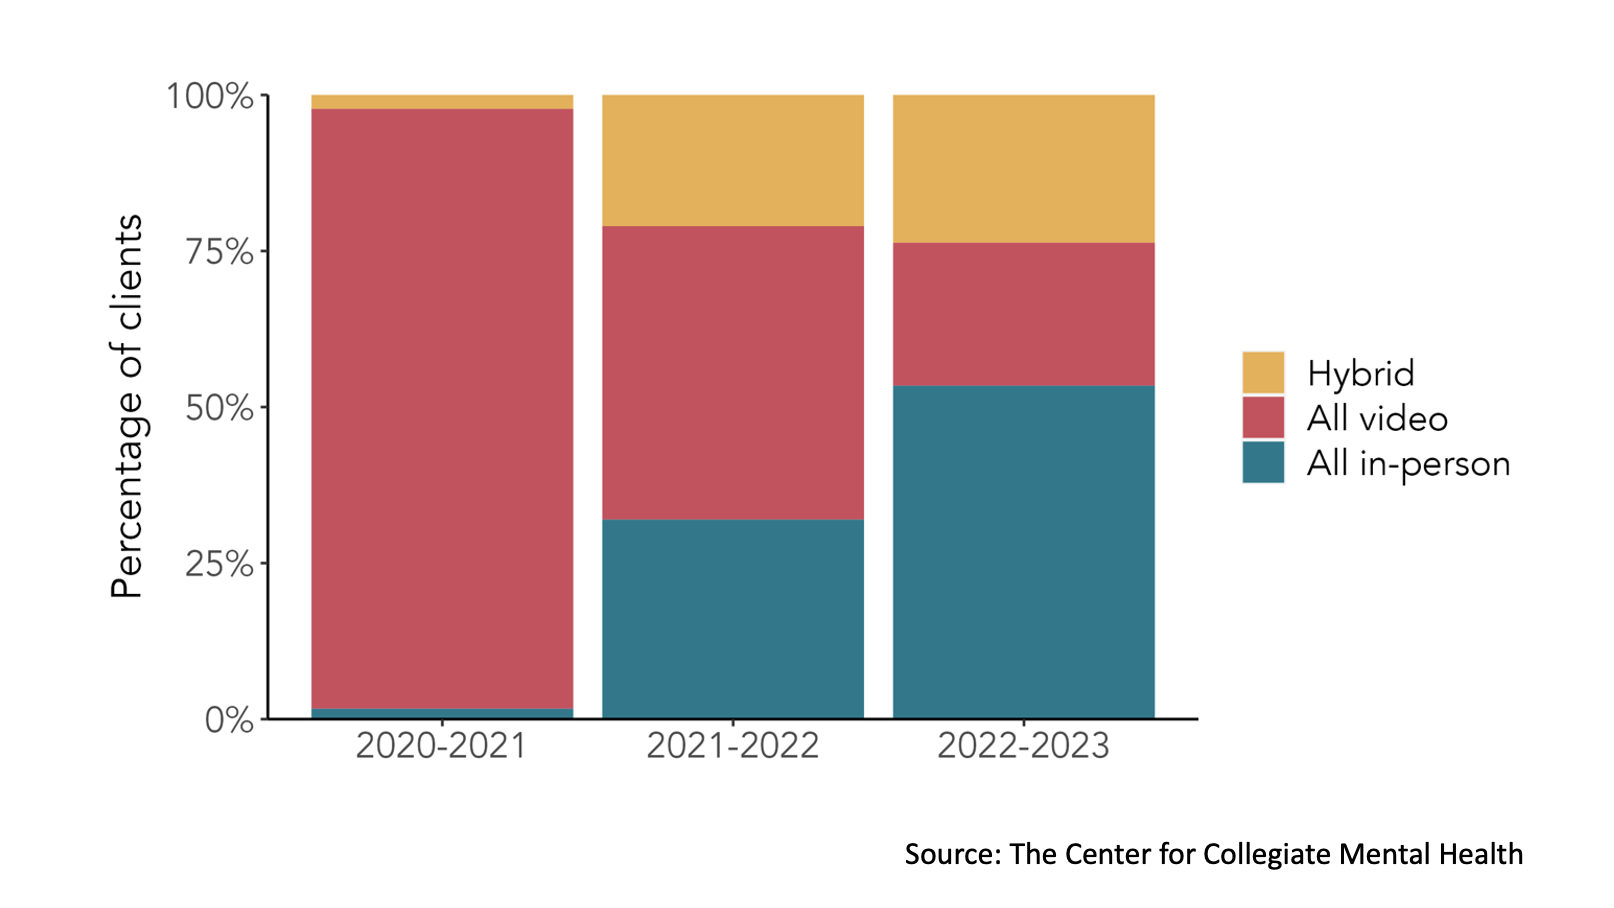
The graph below reflects the three-year changes in the percentage of students who exclusively received services in-person, via video, or through a combination of in-person and video sessions (hybrid). Due to their infrequent use in individual therapy, audio only and text appointments were excluded from these analyses.
In 2020-2021, less than 2% of students solely received services in-person compared to 96% who received treatment via video. However, in the most recent 2022-23 academic year, the frequencies of service modality substantially shifted, where 53% of students exclusively received in-person services compared to only 23% attending all video. The proportion of students receiving hybrid services increased from 2% in 2020-2021 to 24% in 2022-2023.
Do attendance rates differ between modes?
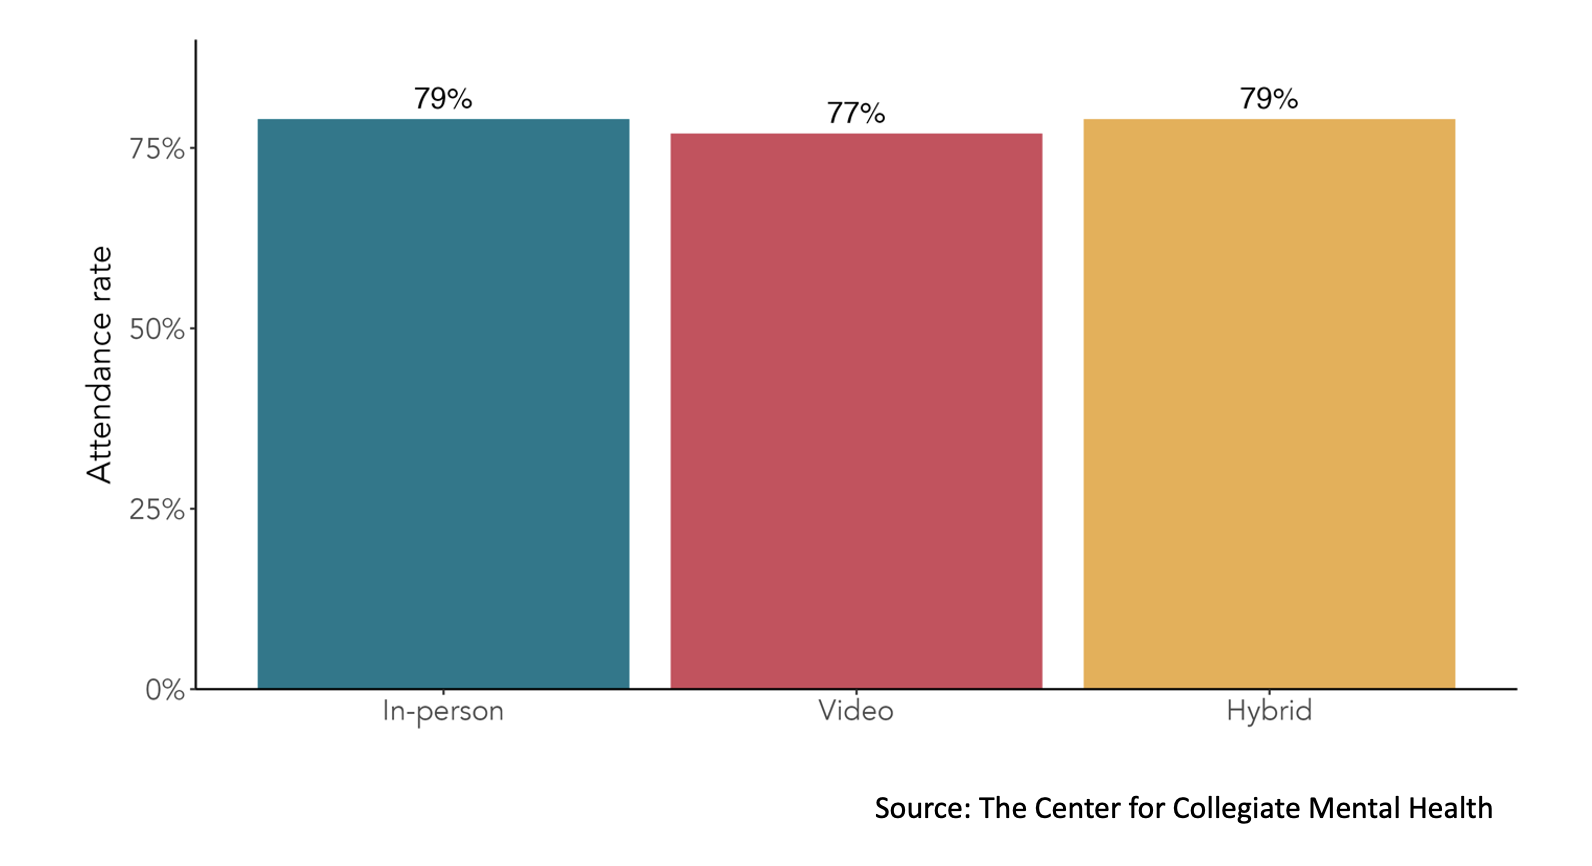
Attendance rates were examined across the different modes of service for the 54,347 clients who received two or more individual therapy sessions during the 2022-2023 academic year. All three modalities demonstrated comparable attendance rates.
Does presenting symptom severity vary by mode?
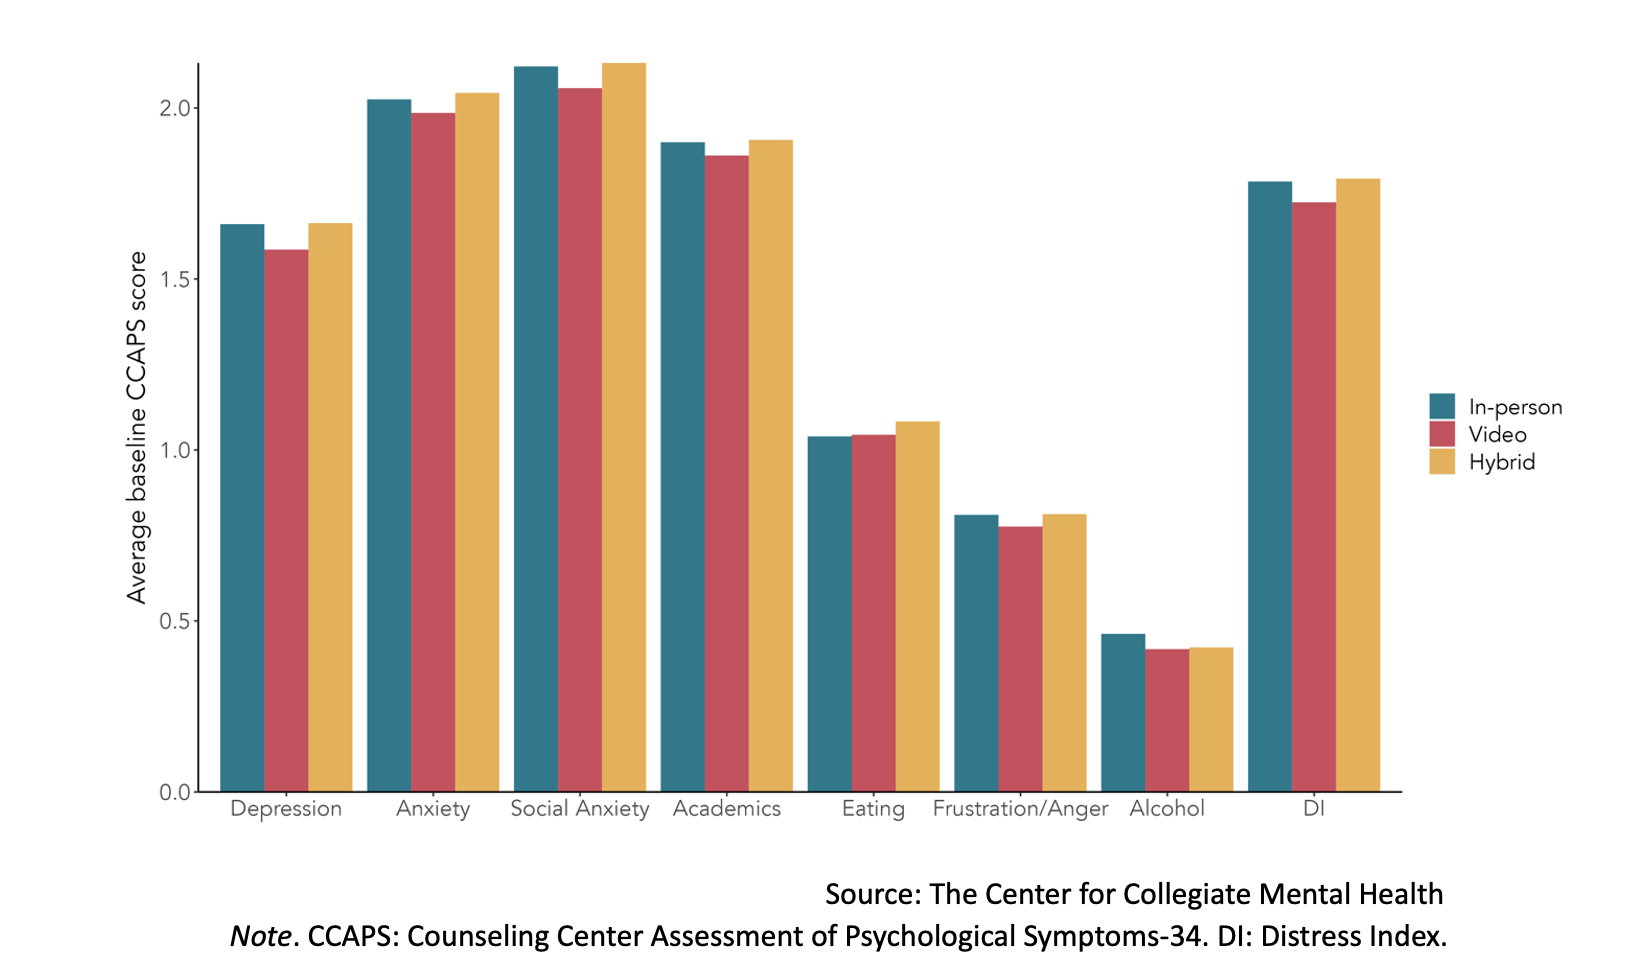
Initial severity of symptoms was examined across the modes of service for the subset of 54,347 clients who received two or more individual therapy sessions during the 2022-2023 academic year. For most CCAPS subscales, clients who received in-person or hybrid treatment reported a higher level of initial distress than clients who only received video services. The exceptions to this pattern were Eating Concerns, which showed modestly higher levels in only the hybrid mode, and Alcohol Use symptoms, which demonstrated similar initial severity in both video and hybrid modalities.
Are there differences in how clients improve in treatment between the service modalities?
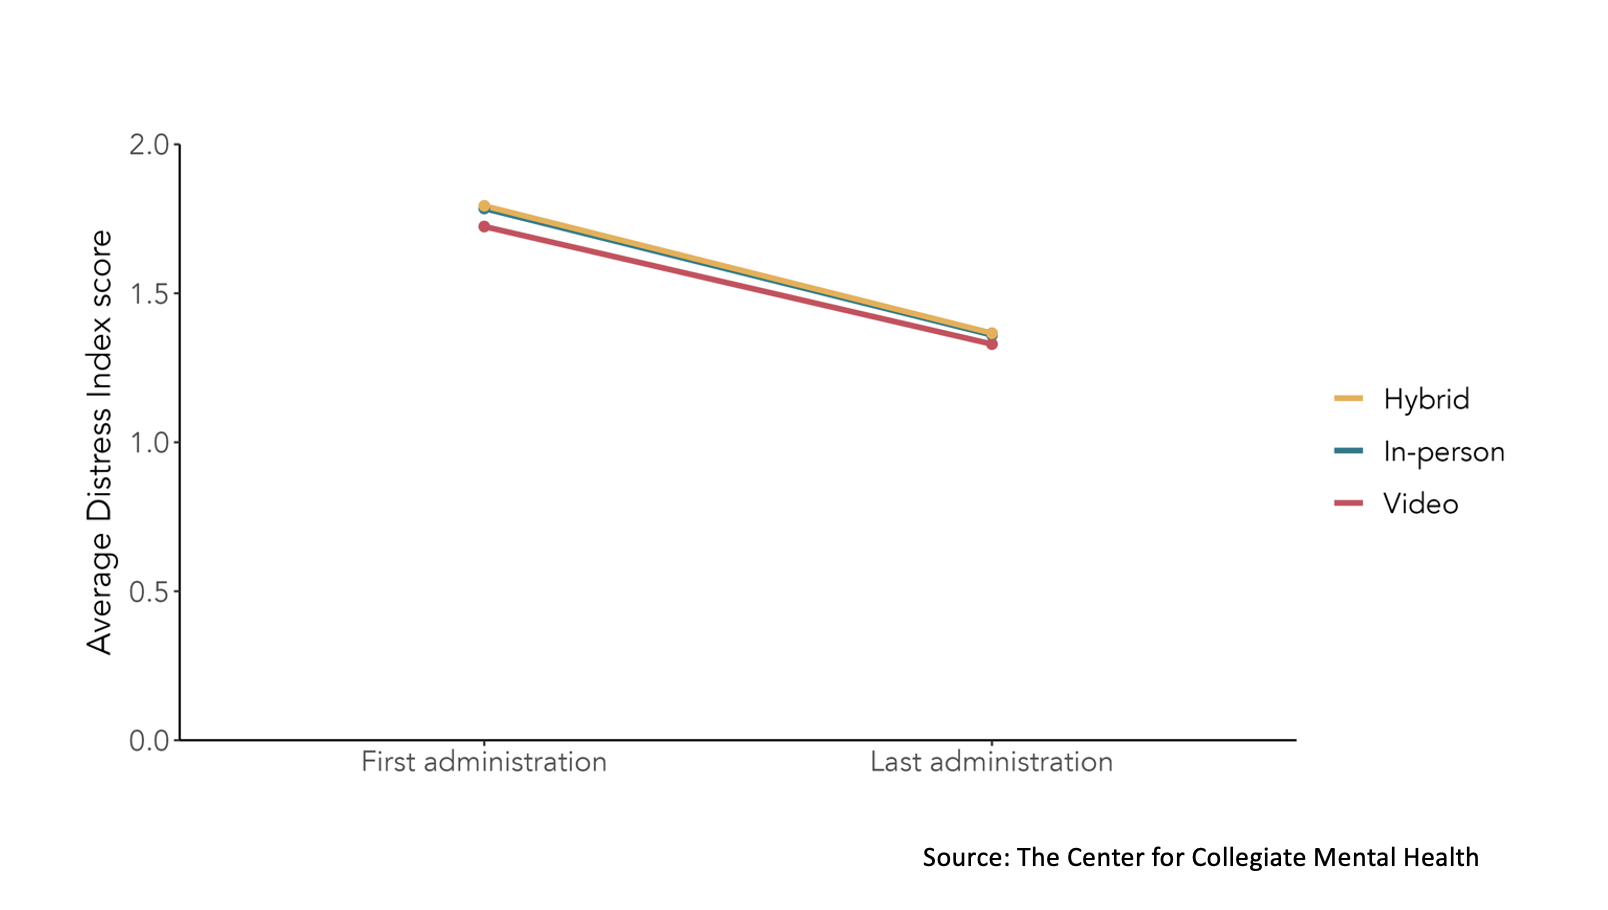
Recent data from a focused study within one counseling center indicated in-person and teletherapy produce equivalent outcomes (Davis et al., 2023). CCMH examined if this finding generalized to the national sample of counseling centers by evaluating overall distress (Distress Index) changes for 54,347 clients who received two or more individual therapy sessions during the 2022-2023 academic year. Specifically, symptom improvement (change in distress between first and last CCAPS administrations) was compared between students who exclusively received video, in-person, or hybrid services. The slope of the lines connecting first and last CCAPS represents their total change on that subscale, where steeper lines indicate more change.
The findings demonstrated that clients, on average, experienced similar levels of improvement across all modes of services. Students who received exclusively video services started treatment with slightly lower baseline distress, as shown in the previous graph, and experienced slightly less change than those who received in-person or hybrid services, but these differences are negligible. Clients generally ended treatment with similar levels of symptom reduction across the three modes.
Summary and Future Directions
In this blog, CCMH investigated the shifting landscape of service delivery within college counseling centers since the onset of the COVID-19 pandemic. This included an examination of changes in the proportion of service modalities delivered, as well as a comparison of attendance rates, initial distress severity, and symptom improvement across video, in-person, and hybrid (combined) modes of care. The following takeaways are noted:
- Clients who exclusively attended in-person services increased from less than 2% in 2020-21 to 53% in 2022-23. Attendance rates were comparable across all three modes (in-person, telehealth, and hybrid). One possible explanation for this is that clients are being referred to service modalities that are a good fit for them, leading to equivalent attendance rates.
- Students who solely received video services, compared to in-person and hybrid care, had lower symptoms on average at the outset of treatment in the 2022-2023 academic year. This could be due to counseling center staff more readily assigning students with milder symptoms to telehealth services or students with less severe symptoms self-selecting into telehealth care more frequently. Alternatively, other factors could be driving this difference (e.g., students with access to private spaces for telehealth appointments also reporting lower distress).
- Clients, on average, experienced similar levels of improvement across all service modalities. While clients who attended video appointments demonstrated slightly lower rates of change, they ended treatment with similar levels of distress between all modes. College counseling center staff should be assured that they are delivering equally effective treatment outcomes, on average, to students in both video and in-person modes of care.
- While counseling center staff produce equivalent improvement in teletherapy and in-person modes of treatment, client preferences for certain modalities are a separate matter. Many counseling centers qualitatively report that a significant percentage of clients continue to prefer in-person therapy. As noted in a previous CCMH blog, there are barriers to teletherapy services for some clients, including the mismatch with the problem severity, lack of access to private space for services, and strong preferences for in-person experiences. Thus, regardless of effectiveness, it is critical for many college counseling centers to retain access to in-person care, especially if the aforementioned barriers are prevalent within the group of students seeking services at a particular center.
- This blog focused on broad comparisons between teletherapy, in-person, and hybrid modes of services. Client characteristics, such as baseline symptom severity, type of presenting problem, and various identity statuses may be relevant in determining who is a good fit for a particular service modality. In the future, studies should be conducted to determine if the effectiveness of certain service modalities vary depending on specific client characteristics.
Davis, K. A., Zhao, F., Janis, R. A., Castonguay, L. G., Hayes, J. A., & Scofield, B. E. (2023). Therapeutic alliance and clinical outcomes in teletherapy and in-person psychotherapy: A noninferiority study during the COVID-19 pandemic. Psychotherapy Research, 1–12. https://doi.org/10.1080/10503307.2023.2229505
Published March 13, 2024